
13639
13644
13646
13648
13652
13654
13655
13656
13657
13658
13659
13643
13647
13650
13651
13653
|
||||||||||||||||||||||||||||||||||||||||||||||||||||||||||||||||||||||||||||||||||||||||||||||||||||||||||||||||||||||||||||||||||
|
|
|
||||||||||||||||||||||||||||||||||||||||||||||||||||||||||||||||||||||||||||||||||||||||||||||||||||||||||||||||||||||||||||||||
|
||||||||||||||||||||||||||||||||||||||||||||||||||||||||||||||||||||||||||||||||||||||||||||||||||||||||||||||||||||||||||||||||||
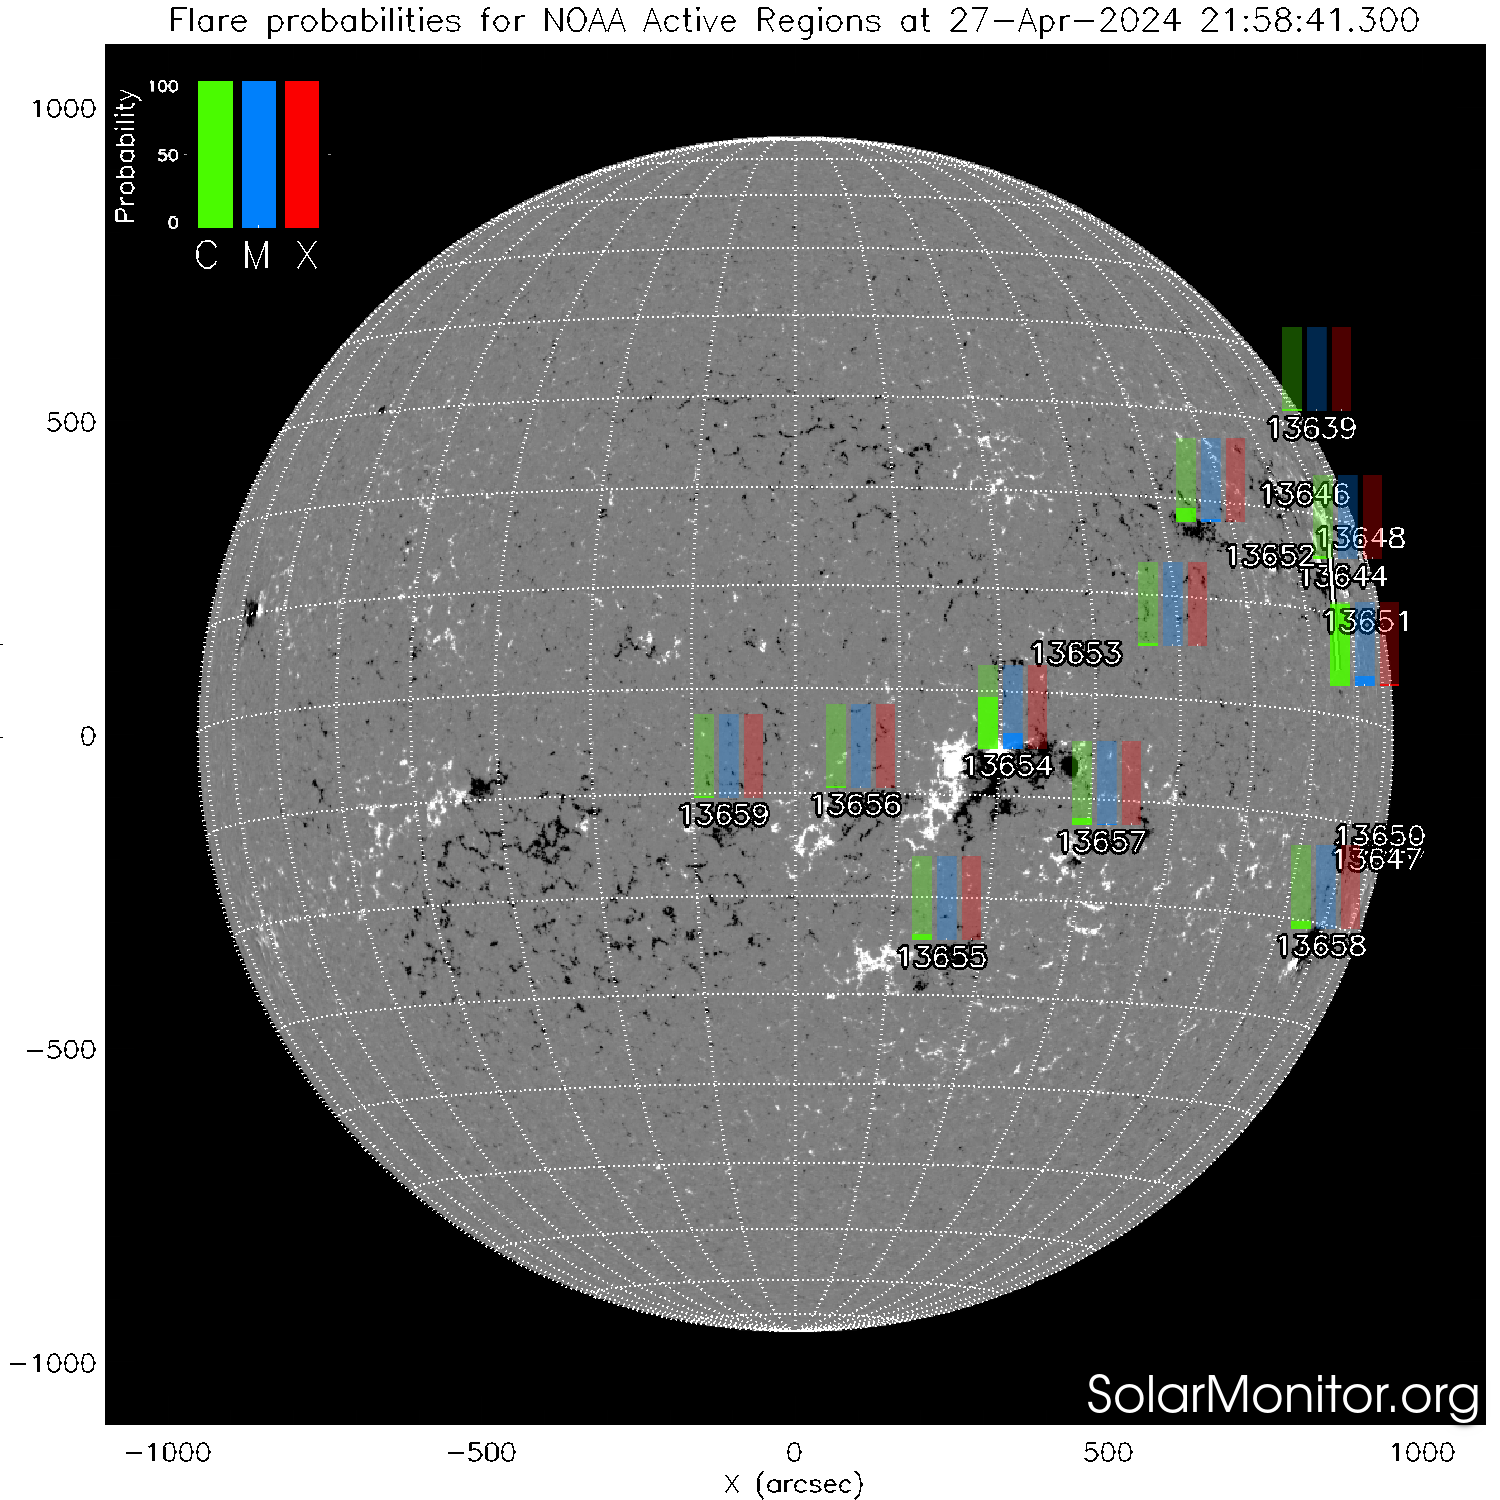
| Today's/Yesterday's NOAA Active Regions | ||||||
NOAA Number |
Latest Position |
Hale Class |
McIntosh Class |
Sunspot Area [millionths] |
Number of Spots |
Recent Flares |
| 13639 | N30W91 (824",473") |
α/β | Axx/Cao | 0010/0020 | 01/02 | - |
| 13644 | N13W71 (878",237") |
α/α | Hsx/Hsx | 0040/0040 | 02/02 | - |
| 13646 | N21W67 (819",367") |
β/β | Cao/Dao | 0090/0130 | 05/09 | - |
| 13648 | N18W86 (903",298") |
βγ/βγ | Dri/Dai | 0080/0080 | 06/08 | - |
| 13652 | N14W56 (768",270") |
α/α | Hsx/Hsx | 0070/0080 | 01/01 | - |
| 13654 | S08W22 (354",-64") |
βγ/βγ | Eai/Eai | 0160/0210 | 19/12 | - / C2.2(17:23)
|
| 13655 | S27W17 (249",-369") |
α/β | Hsx/Dso | 0060/0100 | 01/04 | C2.2(02:47)
/ - |
| 13656 | S12W07 (114",-126") |
α/α | Axx/Axx | 0010/0010 | 01/01 | - |
| 13657 | S15W33 (503",-186") |
β/β | Bxo/Bxo | 0010/0030 | 03/03 | - / C2.6(11:21)
|
| 13658 | S23W74 (843",-352") |
β/β | Dro/Cro | 0060/0020 | 04/03 | - |
| 13659 | S13E06 (-97",-142") |
α/α | Axx/Axx | 0010/0010 | 01/01 | - |
| 13643 | S12W91 (931",-198") |
/β | /Cao | /0020 | /05 | - |
| 13647 | S13W91 (927",-214") |
/β | /Dac | /0120 | /08 | - |
| 13650 | S11W87 (934",-177") |
/ | / | / | / | - |
| 13651 | N09W77 (917",165") |
/ | / | / | / | - |
| 13653 | N03W29 (463",114") |
/ | / | / | / | - / C4.9(21:36)
C3.9(07:41) |
Class (HH:MM) -Today
Class (HH:MM) -Yesterday
|
Events not associated with currently named NOAA regions: C3.3(00:01) C2.4(01:09) C2.5(03:17) C3.1(05:12) C3.6(05:34) C2.6(08:22) C5.0(16:22) M2.1(12:23) M3.0(21:29) C2.2(18:27) C2.6(18:44) C3.4(18:58) C4.9(19:28) C3.6(19:42) C6.1(19:43) |
|
Note: The tabulated data are based on the most recent NOAA/USAF Active Region Summary issued on 27-Apr-2024 00:30 UT . The greyed out and light-blue entries are values from the previous day. Slashed cells indicate that the active region has no spots. The latest positions of the active regions are given in both heliographic and heliocentric co-ordinates. The region positions are valid on 27-Apr-2024 23:30 UT . |