
14028
14030
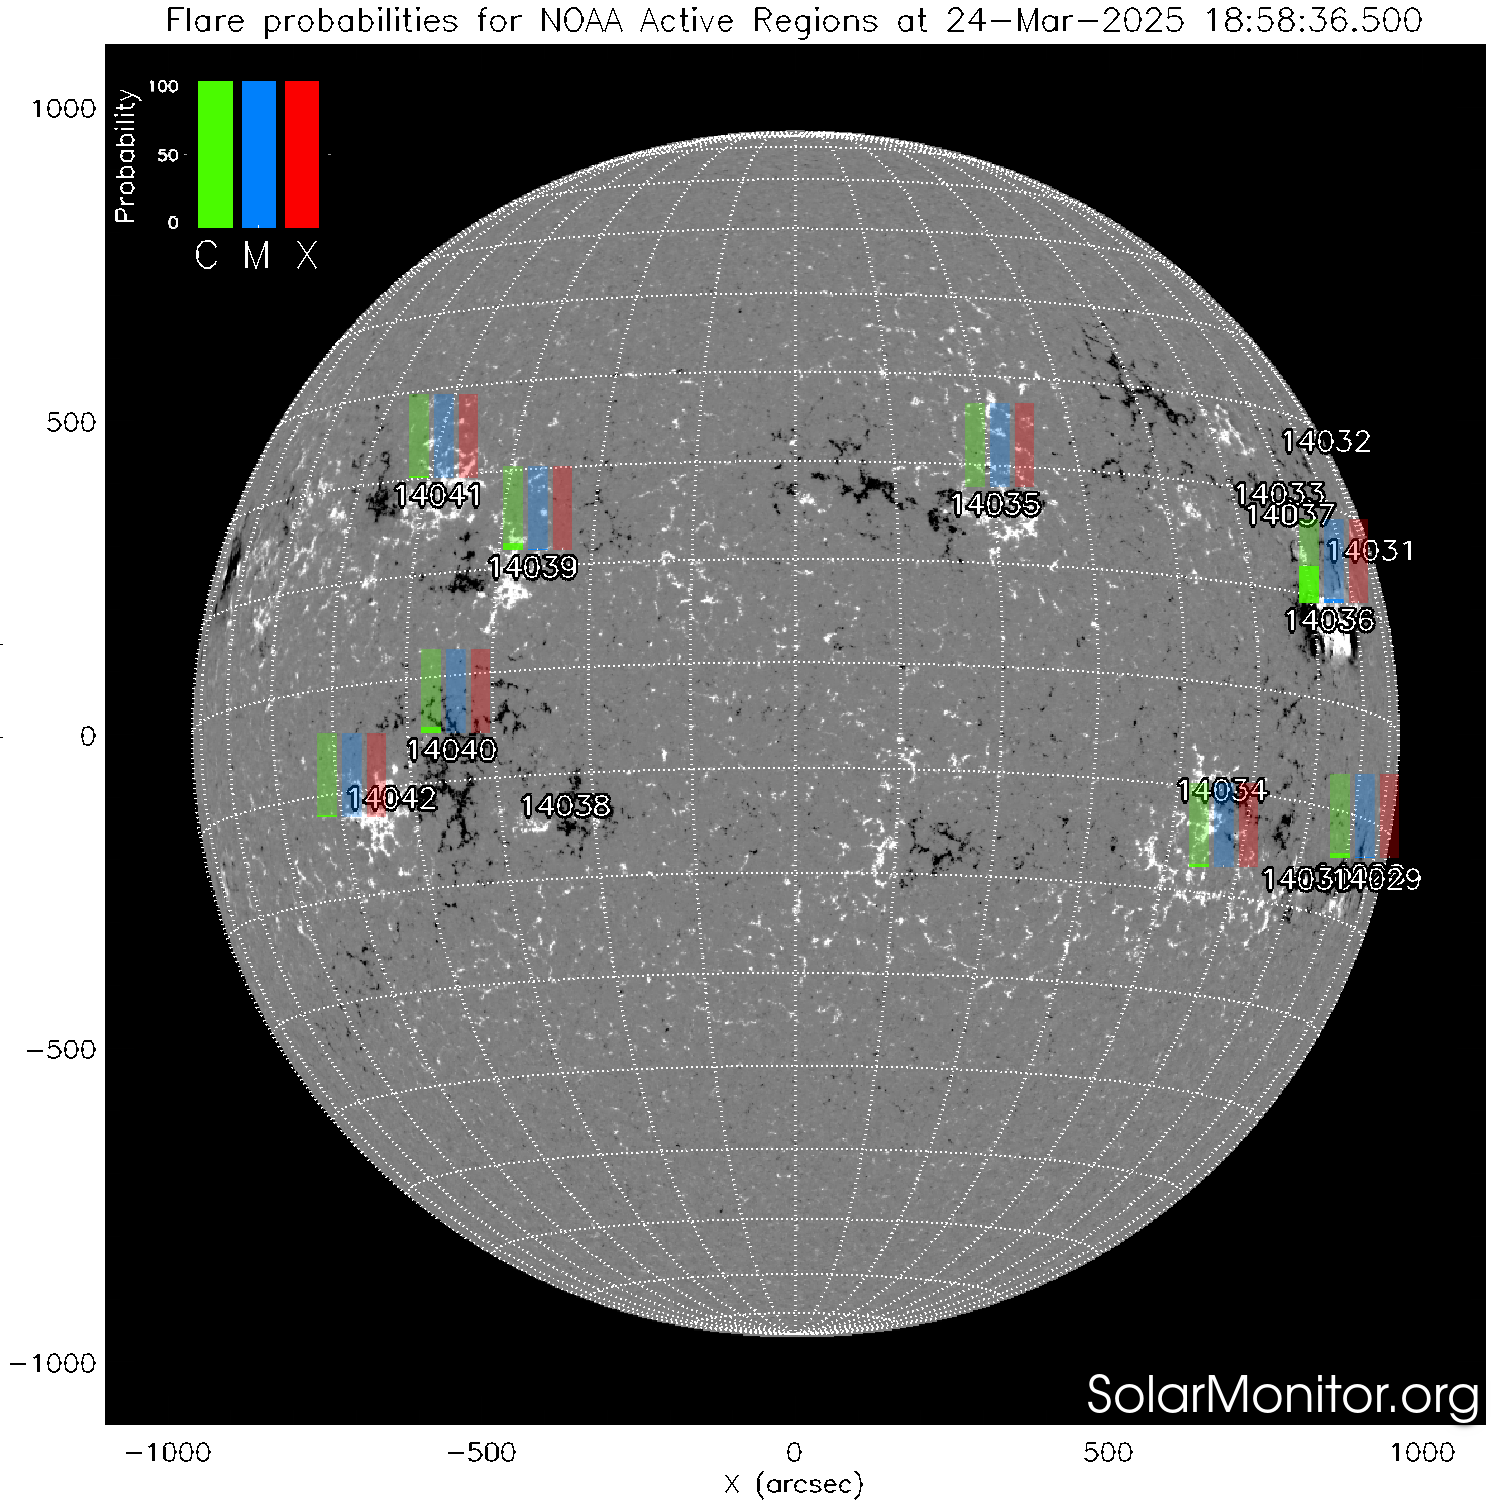
14035
14036
14039
14040
14041
14042
14029
14031
14032
14033
14034
14037
14038
|
|||||||||||||||||||||||||||||||||||||||||||||||||||||||||||||||||||||||||||||||||||||||||||||||||||||||||||||||||||||
|
|
|
|||||||||||||||||||||||||||||||||||||||||||||||||||||||||||||||||||||||||||||||||||||||||||||||||||||||||||||||||||
|
|||||||||||||||||||||||||||||||||||||||||||||||||||||||||||||||||||||||||||||||||||||||||||||||||||||||||||||||||||||
| Today's/Yesterday's NOAA Active Regions | ||||||
NOAA Number |
Latest Position |
Hale Class |
McIntosh Class |
Sunspot Area [millionths] |
Number of Spots |
Recent Flares |
| 14028 | S16W78 (905",-240") |
β/β | Bxo/Cri | 0030/0040 | 04/06 | - / C2.1(18:43)
C2.4(07:55) |
| 14030 | S18W64 (823",-247") |
α/α | Hsx/Hsx | 0080/0100 | 01/01 | - |
| 14035 | N15W21 (334",352") |
β/β | Cro/Dro | 0040/0080 | 06/07 | - / C1.8(22:53)
C1.8(16:11) C4.6(14:18) C2.6(10:22) |
| 14036 | N07W64 (859",166") |
βγ/βγ | Dai/Dac | 0230/0220 | 12/15 | - |
| 14039 | N09E25 (-403",253") |
β/β | Bxo/Bxo | 0010/0010 | 03/03 | - |
| 14040 | S08E34 (-534",-38") |
α/α | Axx/Hax | 0020/0030 | 02/01 | - |
| 14041 | N17E37 (-555",368") |
α/α | Axx/Axx | 0010/0010 | 01/01 | - |
| 14042 | S12E42 (-631",-115") |
α/α | Axx/Axx | 0010/0010 | 01/01 | - |
| 14029 | S15W90 (929",-247") |
/ | / | / | / | - |
| 14031 | N17W91 (919",277") |
/β | /Cao | /0080 | /04 | - |
| 14032 | N28W88 (848",451") |
/ | / | / | / | - |
| 14033 | N19W59 (781",367") |
/ | / | / | / | - |
| 14034 | S11W47 (692",-105") |
/α | /Axx | /0010 | /01 | - |
| 14037 | N17W60 (798",334") |
/β | /Bxo | /0010 | /04 | - |
| 14038 | S14E22 (-351",-127") |
/β | /Bxo | /0010 | /02 | - |
Class (HH:MM) -Today
Class (HH:MM) -Yesterday
|
Events not associated with currently named NOAA regions: C2.0(00:27) C1.3(03:27) C1.3(04:39) C5.2(07:25) C1.6(11:07) C2.3(13:26) C1.4(16:21) C1.4(18:30) C2.9(10:38) C1.7(11:43) C1.7(11:59) C2.1(16:36) C2.5(21:06) |
|
Note: The tabulated data are based on the most recent NOAA/USAF Active Region Summary issued on 24-Mar-2025 00:30 UT . The greyed out and light-blue entries are values from the previous day. Slashed cells indicate that the active region has no spots. The latest positions of the active regions are given in both heliographic and heliocentric co-ordinates. The region positions are valid on 24-Mar-2025 20:30 UT . |